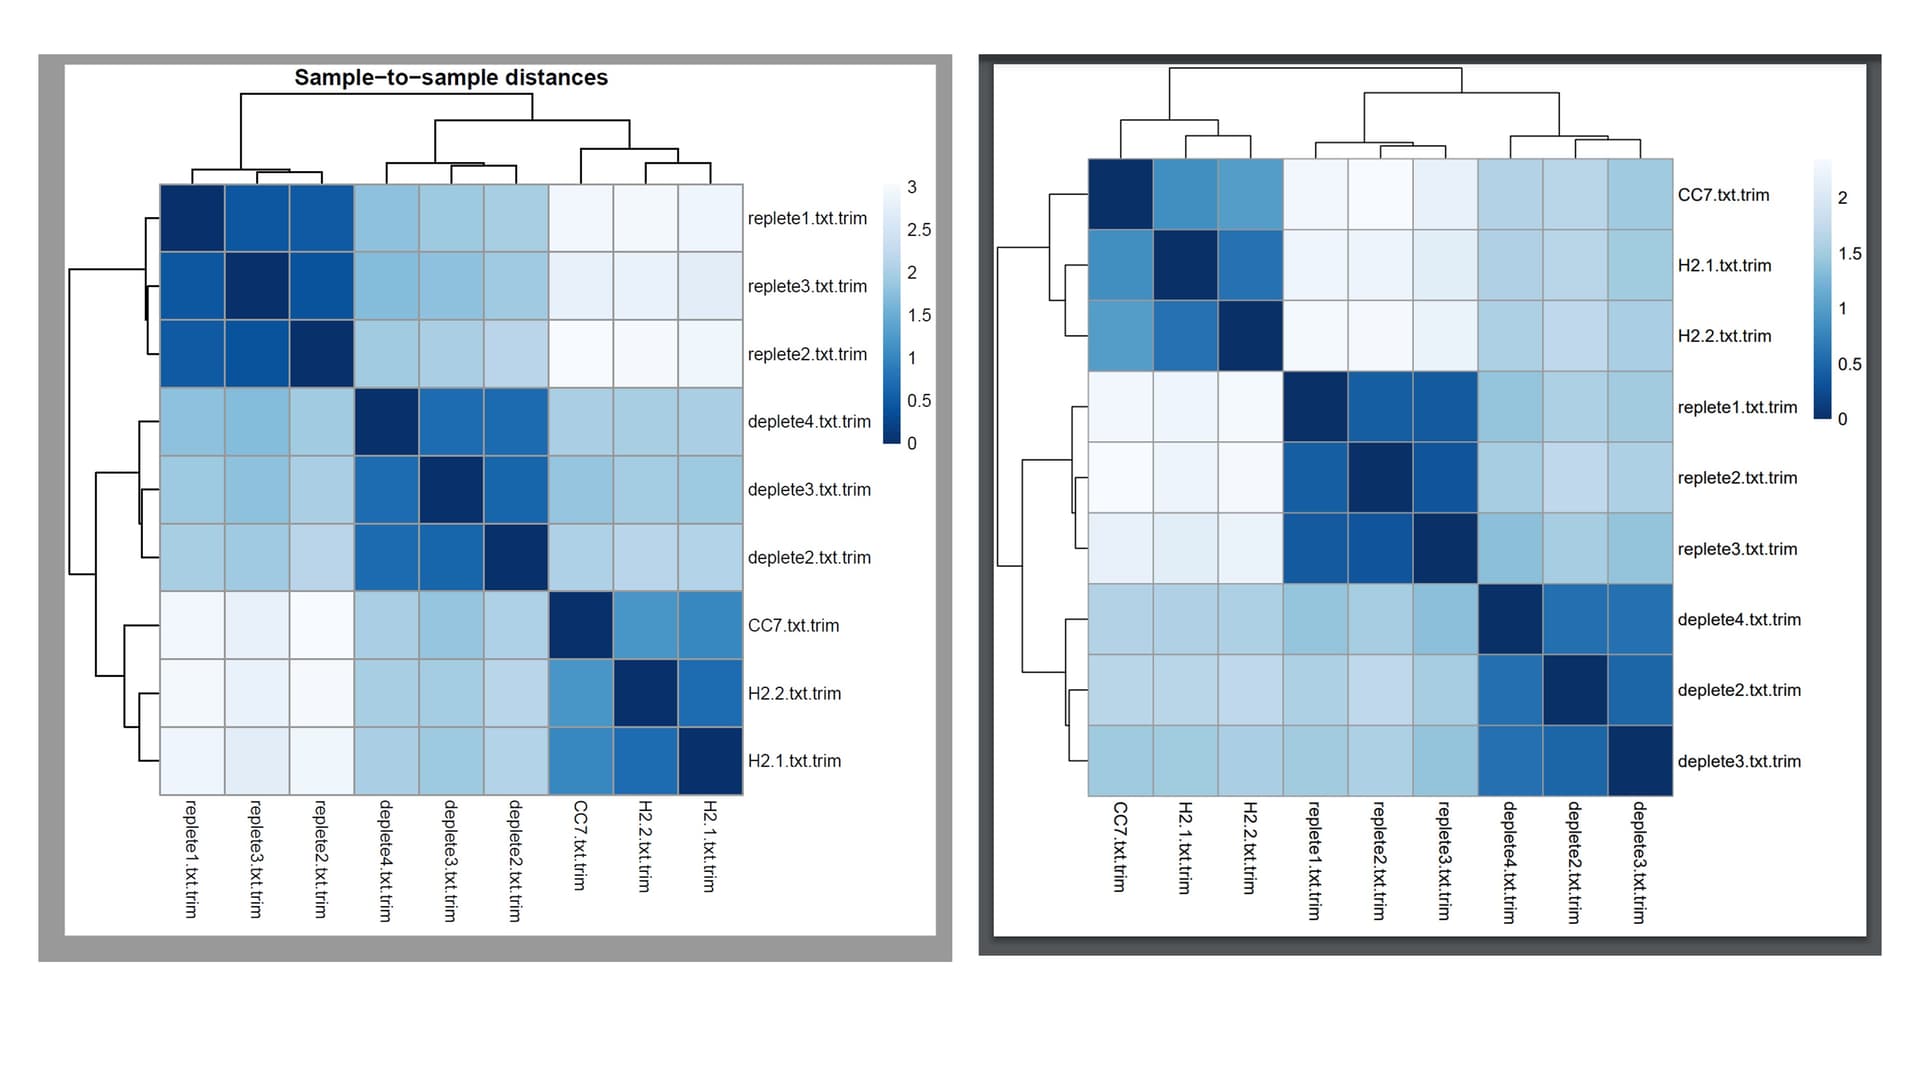
I ran DESeq2 on usegalaxy.org and generated the figure on the left. I then took the VST file exported on Galaxy and ran the following code on R to generate a similar heatmap:
sampleDists <- dist(t(assay(vsd)))
library("RColorBrewer")
sampleDistMatrix <- as.matrix(sampleDists)
rownames(sampleDistMatrix) <- paste(vsd$condition, vsd$type, sep="-")
colnames(sampleDistMatrix) <- NULL
colors <- colorRampPalette( rev(brewer.pal(9, "Blues")) )(255)
pheatmap(sampleDistMatrix,
         clustering_distance_rows=sampleDists,
         clustering_distance_cols=sampleDists,
         col=colors)
As you can see from the figures, the distance on the clustering looks the same for both, but the groupings are drawn differently. Which is correct? Any idea what could have happened?