Welcome @pedrojesus !
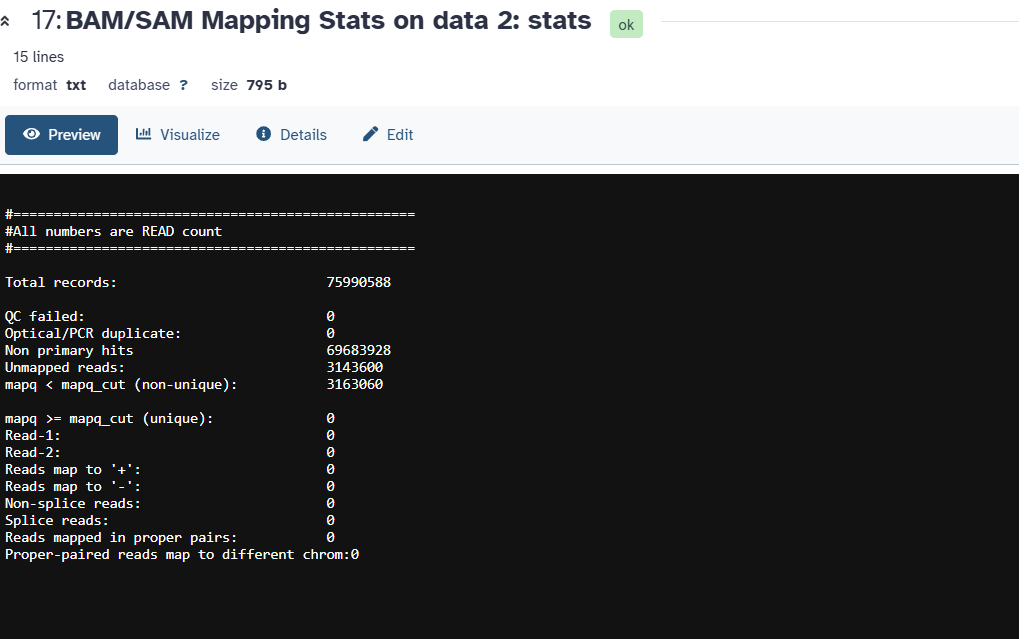
How to interpret these metrics is hosted at the original author’s website here.
- RSeQC: An RNA-seq Quality Control Package — RSeQC documentation
- All guides here → https://rseqc.sourceforge.net/
The RSeQC package is just one choice to explore a BAM file. Galaxy also includes most the Samtools suite too and these also function exactly like the underlying original tools.
- Guide → samtools(1) manual page
And this is a shared history with an example of three of these tools plus a tool (MultiQC) that will combine multiple reports into a graphical summary.
With that context, for your question
I would suggest trying the tool Samtools flagstat. An example of the output is on the tool form down in the Help section.
This is what the table looks like using my test data in the shared history above.
9856588 + 0 in total (QC-passed reads + QC-failed reads)
9856588 + 0 primary
0 + 0 secondary
0 + 0 supplementary
0 + 0 duplicates
0 + 0 primary duplicates
8285719 + 0 mapped (84.06% : N/A)
8285719 + 0 primary mapped (84.06% : N/A)
9856588 + 0 paired in sequencing
4928294 + 0 read1
4928294 + 0 read2
7097710 + 0 properly paired (72.01% : N/A)
7749706 + 0 with itself and mate mapped
536013 + 0 singletons (5.44% : N/A)
242372 + 0 with mate mapped to a different chr
128622 + 0 with mate mapped to a different chr (mapQ>=5)
For more, this tutorial explains a bit about what is inside of a BAM file and how to visualize the result in the IGV genome browser.
 Hands-on: Mapping / Mapping / Sequence analysis from Learning Pathway: Introduction to Galaxy and Sequence analysis
Please let us know if this helps or not! ![]()
