I am trying to convert my vcf into an tab-delimited format. When using the VCFtoTab-delimited from usegalaxy.com, I saw, that all the variants having annotations to more than one transcript are excluded in this process. So I end up with a tabular file with missing information.
Correct, the tool expects that variants are unique to be valid. Filtering your BAM dataset by mapQ = 20, before calling variants, will help ensure that your SNPs are unique. Try using Filter BAM datasets on a variety of attributes (Galaxy Version 2.4.1) or just search with keywords “bam” and “filter” to see all options.
If an option is unclear (for any tool), try a toggling/testing options and review related tools until you get the output you want. And review the underlying tool’s documentation (will usually be linked on the tool form).
There are many ways to manipulate both vcf and tabular data in Galaxy.
A VCF with the header removed is a tabular dataset, but data won’t be parsed out the same way as VCFtoTab-delimited. That said, tools under the grouping GENERAL TEXT TOOLS could be used to create your own data parsing choices from vcf-no-header formatting.
If you want to remove the VCF header, use Select with the option to keep only lines that do not match the regular expression: ^#. Change the datatype to be tabular after (pencil icon > Datatypes) so the other text manipulation tools will recognize the dataset as an appropriate input.
Hi - Have another tool choice: BCFTOOLS bcftools query Extracts fields from VCF/BCF file and prints them in user-defined format.
This tool will output the “first” multi-mapping SNP. Might be worth comparing the output versus a mapQ=20 filtered BAM > SNPs called to create VCF > then run through VCFtoTab-delimited.
thanks for your help. As I only have the original vcf (already including annotation) on hand and not the bam files, I suppose the best option to not lose any annotated data is to remove the VCF headers and use a general text tool to create a tab separated format, which will seperate all the information in the e.g. the INFO field. With what exact tools would I do so?
Many thanks!
Rose
Try using this tool first to “break up” any merged alleles that may be present in your data. The tool order would be:
VCFbreakCreateMulti: Break multiple alleles into multiple records, or combine overallpoing alleles into a single record (Galaxy Version 1.0.0_rc1+galaxy0) – use the “Break” option on the form
VCFtoTab-delimited: Convert VCF data into TAB-delimited format (Galaxy Version 1.0.0_rc1+galaxy0)
(and I just found a typo in a tool description, eg “overallpoing” – will report that! should be “overlapping”)
so I tried the VCFbreakCreateMulti followed by the VCFtoTab-delimited. However, I was left with exactly the same.
I am working with two different panels (TST170 from Illumina and Human Breast Cancer Panel from QIAGEN) (using different Variant Callers and Annotation Tools supplied by each company). I installed a galaxy docker on our Linux Server and tried the VCFtoTab again on the galaxy docker and compared it to the data using the VCFtoTab on use galaxy.org. Interestingly I found differences: Regarding the data from the Human Breast Cancer Panel (QIAGEN) there was no missing data in the INFO field anymore, when using VCFtoTAB on the galaxy docker. Unfortunately this was not true for the TST170 Panel (Illumina)- here I only found a decrease of variants with missing INFO fields.
I do not understand why the VCFtoTAB on the use galaxy.org works different than the VCFtoTAB on my galaxydocker. Do you?
Anyways, I am still stuck with the vcfs of my TST170 (Illumina) data.
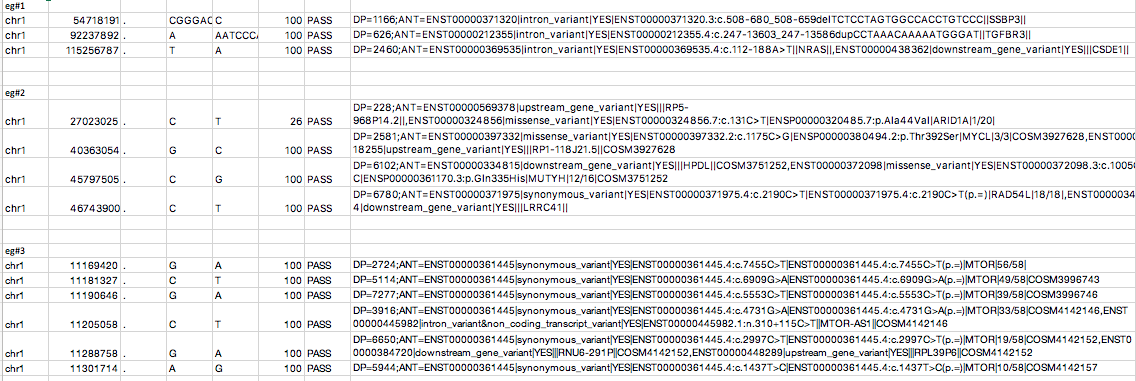
In the attached picture you find example variants, where information from the INFO field
eg#1 did neither get lost using VCFtoTab on the galaxy docker nor on galaxy.org
eg#2 did get lost using VCFtoTAB on galaxy.org, but did not get lost using the galaxy docker
eg#3 did get lost using VCFtoTAB on galaxy.org and also using the galaxy docker
Do you have a possible idea why the information gets lost and what I can possibly do to avoid that?
The version of the tool at Galaxy Main https://usegalaxy.org is: VCFtoTab-delimited: Convert VCF data into TAB-delimited format (Galaxy Version 1.0.0_rc1+galaxy0)
Maybe your docker Galaxy has a different version installed? Sometimes there are small-point changes/fixes that are not large enough to trigger an updated tool version – so you could reinstall the tool and see how it works.
It is difficult to tell why some lines are getting missed. My guess is that it is format-related. Maybe try sorting the VCF data and see if that makes a difference? Tool: VCFsort
The version I use on my docker is: VCFtoTab-delimited: Convert VCF data into TAB-delimited format (Galaxy Version 1.0.0_rc1+galaxy0), which is exactly the same as the one used on usegalaxy.org. (Galaxy Version 1.0.0_rc1+galaxy0).
Interestingly VCFtoTAB works better on the docker than it does on usegalaxy.org.
Thanks for the new idea to use the VCFsort first. Unfortunately it does not change anything.
What else would you purpose doing in order to access my vcf-data with excel (nicely split up tab format) without losing any information?
Odd. But to just manually split up the data values, try this (uses tools from the “GENERAL TEXT MANIPULATION” tool groups):
Remove the header with the tool Select using “not matching” and the regular expression ^@. That could be reversed to be “matching” if you want to keep the header instead for some other use in another file. You probably don’t want that in your Excel spreadsheet, or at least not in the same sheet. But if you want it, then add it back after the rest of the data is manipulated: Tool: Concatenate.
Change the datatype on the “not matching” result to be tabular by clicking on the pencil icon (upper right corner of the dataset) to reach the Edit Attribute forms. Tab into “Datatypes” and assign the datatype tabular.
Break up data values using the tool Convert delimiters to TAB. Run once with semicolons ; and (optionally) run once with pipes |.
Converting pipes to tabs is going to produce some lines that don’t exactly match others. Some of those values are NULL in your data lines (expected), plus some data lines have repeating data (also expected), so that is optional.
You might want to experiment with other tools to deal with the pipes/empty values. Examples:
Replace Text in entire line – could convert || values to be something like |NULL|, then run the Convert delimiters to TAB
Text transformation with sed – you can play around with queries, but something like this will fill in empty values with “NULL”, but you can pick whatever you want as a placeholder value: dot . etc, anything that is one “word” and won’t conflict with values are you converting to tabs: s/||/|NULL|/g
sed is very powerful and can do much more. There are guides/posts all over the web if you are not familiar with the tool (is a unix utility).
Now, I don’t think this tool will get you the formatting you want (will create repeating lines), but still could try it and review:
Unfold columns from a table – split on pipes
The vcf-to-tab tool is from a 3rd party – we just wrapped it to work through the web in Galaxy. The underlying tool’s functionality is determined by the original authors. A link to them is on the tool form. You might want to show them your data and ask if they would consider upgrading the tool to work with it. I don’t think the tool is buggy – rather, it simply has trouble parsing one of your versions of vcf data (format/content).
Why you are getting a different result at .org versus your docker – not sure, could be many factors: tool dependencies, the Galaxy software version, or some semi-random “decision” behavior that the tool performs when given non-standard inputs. The latter is the most likely reason and probably involves a cascade of “rules” the program goes through. That process may not be necessarily reproducible across different compute environments.
Inconsistencies like that somewhat common (not just this tool) are one of the reasons why there is such a big push that reproducible analysis needs to be described in publications very precisely. Not only the data/tools/versions/paramaters used, but also the entire exact compute environment used. Part of why Docker containers are so useful is because entire environments can be saved/published/used by others.
thanks a lot for your detailed and fast response!
I tried out the options you mentioned, but cannot make them work properly. I am always left with the same problem: As the data in the ID, Filter and INFO field of the vcf is separated by “;”, but the number of values seperated by “;” changes between lines, the majority of lines do not match up in the end. This is also true for the data in the FORMAT field of the vcf, which ist separated by “:” (e.g. 10 separated values “GT:GQ:AD:DP:VF:NL:SB:NC:AQ:GQX” in one line versus 9 separated “GT:GQ:AD:DP:VF:NL:SB:NC:GQX” in another line).
What would you suggest doing?
I also contacted the original authors go the vcf-to-tab and asked them if it is possible to upgrade the tool to work with my data.
Thank you ever so much for your help. I hope we can find a solution for my problem!
Rose
Yes, it will be tricky to parse out the data. As you noticed, some of the “delimiters” between data in one column are used as “content” in other columns on the same line. And some of values may be present in some lines but not others.
All that is expected and why it is so difficult to parse out the data manually (in a meaningful way). There isn’t a one-size-fits-all method.
I’d wait and see what the tool authors have to say. That tool is your best choice. Why it isn’t working with one of your VCF formats is almost certainly based on a different format/content than the tool is currently designed to parse. The tool would need to be updated to interpret it correctly.
Hi @jennaj
I talked to one of the developers and they asked me to try again the bcftools query.
I tried out the tool and it worked well for rather simple queries. However I am stuck at the point where I would like to only extract the first annotation of the ANN Tag in the Info field.
This is what I used for a query in Galaxy (toolshed.g2.bx.psu.edu/repos/iuc/bcftools_query/bcftools_query/1.4.0):
I am left with the following error message: Error: todo: type 7
I actually wanted not only to extract the first Annotation of the comma separated list of annotations in the ANN Tag of the INFO field, but I also wanted to further split this first annotation in its subcontents, which are separated by “|”.
Furthermore and more importantly I don’t know how to handle the problem that my gnomad annotation for genome and exome have the same INFO-Tag and bcftools only extracts one of those values (vcftotab always generated a comma separates list for alle the values available for that one INFO-TAG). Do you have any suggestions?
After a bit of detective work we found the reason for the discrepancy between @roselucia’s local result and those on usegalaxy.* instances: it’s caused by ambiguous dependency versioning.
I’ve documented the details and what we decided to do for usegalaxy.eu in https://github.com/usegalaxy-eu/usegalaxy-eu-tools/issues/249. @jennaj note that with the change on the usegalaxy.eu side all tools from the vcflib tool collection could potentially give different results on usegalaxy.eu and usegalaxy.orgat the seemingly same version - just as results may differ between local instances and usegalaxy.org.