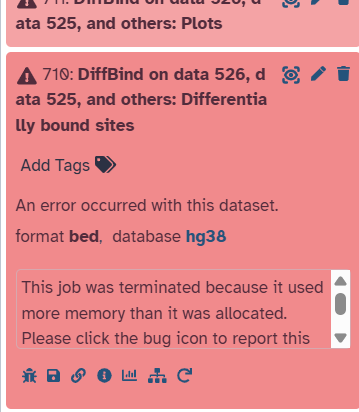
I am facing a similar issue in diffbind which has been partly addressed before. The error i got on galaxy was - the job is terminated because it used more memory than allocated. I had allocated the 1TB memory as the location for the output files which is only 30 percent used up. My input files for diffbind are of correct format and are an output of MACS2. I changed the score parameter to the 8th column as well. Could you please help me with how i should proceed further to carry out my diffbind analysis? I have attached a picture below.
Hi @anushree
Yes, it is very difficult to get this to run on larger datasets due to the memory usage. Trying at UseGalaxy.eu might help. I would also suggest organizing all of the data into collections, since the pairing between the files needs to be exact. You can see how the files are pairing on the job details view to see what I mean about this, or topics like this one → Diffbind memory issues - #2 by jennaj
Technically, it is best to start off with collections, since that will add in the same element identifier to both parts of a particular peak-bam pair by default, but this can be applied after if needed. See the Collection Operation tools. Guides on each with tutorials at the bottom. Ask if you get stuck please! ![]()
To clarify for this part:
The 1 TB storage space is where output files are written. This is distinct from the runtime computational memory a tool might need. So – storage versus compute. The compute on the public servers is truly large but sometimes still not enough, and is different across servers for technical reasons. The EU server will execute some tools with a bit more memory. This is one of them, which is why I am suggesting to give it a try there before deciding that a public Galaxy cannot process the work. More details about this type of error (any tool) → This job was terminated because itused more memory than it wasallocated. - #2 by jennaj
As a last suggestion: I’ve seen a lot of errors like yours that were due to very minor usage issues. You could also try going into the RStudio environment at any Galaxy server and running the tool directly in R, following Bioconductor’s exact procedures. This would access the same server clusters but is one way to test to see if the issue is actually your data size/complexity, or how the job is set up on the form. A test with a smaller subset like a single chromosome from each sample would be a good way to test the job logic in either environment.
Hope this helps!
I have attached a link to the history. I am now trying to use UseGalaxy.eu. Using RStudio environment might not work for me since my system has a less processing memory.
Galaxy - link. From the history i set the input in the first group as 565:MACS2 callpeak on collection 41 (narrow Peaks) - as peak file1, 41:Bowtie2 on collection 5: alignments - as bamfile1 and in the second group 562:MACS2 callpeak on collection 177 (narrow Peaks) - as peak file and 527:Bowtie2 on collection 176: alignments - as the bam file.
Hi @anushree
Thanks for sharing the history. I see a few problems.
The “intervals” for the DE comparison hasn’t been defined yet in the data, the BAMs and peaks are still raw against the entire genome. This is unlikely to produce what you would find to be informative, even if it was possible to process.
An example is in the vignette from Bioconductor here → https://bioconductor.org/packages/release/bioc/vignettes/DiffBind/inst/doc/DiffBind.pdf.
For this part, it can run in Galaxy using our clusters.
For a different ways to generate binding comparisons using the data you have, these are a good tutorials. Both use DeepTools and related tools to explore peak differences between sample groups.
- Histone modification – given your accession IDs, this sounds very similar to your goals? Hands-on: Formation of the Super-Structures on the Inactive X / Formation of the Super-Structures on the Inactive X / Epigenetics
- Protein binding – not a great fit but you can review. I’m including it because the instructions for IGV can be used with the tutorial above (instead of Trackster): Hands-on: Identification of the binding sites of the T-cell acute lymphocytic leukemia protein 1 (TAL1) / Identification of the binding sites of the T-cell acute lymphocytic leukemia protein 1 (TAL1) / Epigenetics
In short, the technical organization of sample groups (experimental design) is just one part of getting this to run correctly. The data itself still needs to have the correct content. Diffbind will work similar to how DESeq2/EdgeR work with other types expression data: define the genomic regions to investigate, count up expression per sample then per sample group applying normalization, then compare values between groups to explore the up/down expression differences.
Hope this helps! ![]()