Dear support team at GALAXY,
I have recently performed a ChIP-seq experiment consisting of:
2x WT (neg. ctrls: a strain that has no GFP tagged proteins but was subjected to the IP with the anti-GFP)
2x TF1-GFP (IP with the anti-GFP)
2x TF2-GFP (IP with the anti-GFP)
3x TF3-GFP(IP with the anti-GFP)
Some necessary details:
-The ChIP was performed simultaneously with all 9x samples
-All TFs were previously checked in the confocal, in the same dev. stage that I later performed the fixation of my ChIP, and they showed clear nuclear signals.
-The background of all TF strains is the same Wt that I have used as neg. Ctrl
After the seq, I got 2x files with reads for each sample. Thus, I had to uncompress and then combine them with the “Concatenate datasets” tool and then proceed to the mapping with Bowtie2. I did the same of course with all 3x TFs and I got for all very good % of uniquely mapped reads avg. 85% out of ca. 50 mio reads/sample.
I have then tried to identify statistically significant peaks for TFs with MACS2. The analysis of TF1 and TF2 did work great. With the analysis of TF3 I have a problem, or at least I cannot rule out at the current stage, if I have a rather technical problem with my analysis, that I should solve, or if simply the TF3 at the point of sampling has no binding to DNA whatsoever however is nuclear-localized.
When I am running MACS2 for peak identification of TF3 I am getting the message in the Image_1 (see attachments).
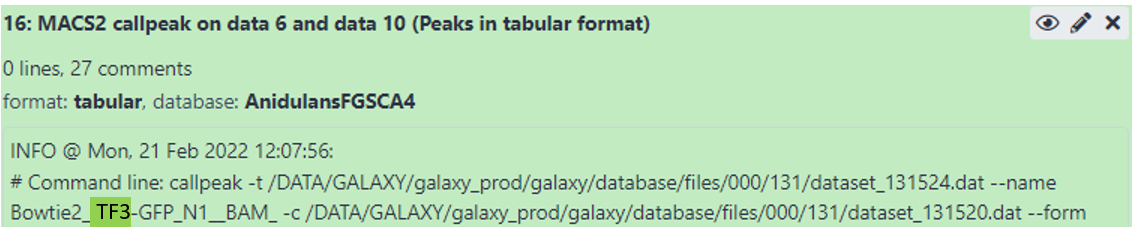
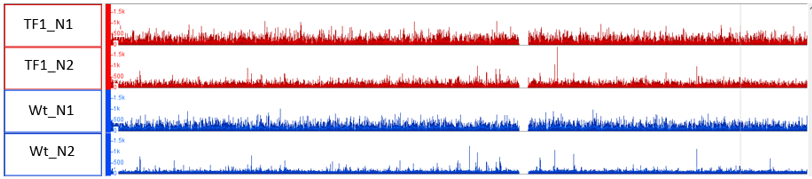
Please note that I am getting the same message no matter which combinations of Wt and TF3 samples I choose. I am getting the same output even when I am playing with different settings of the MACS2 (e.g make a model or make no model etc). What is weird to me is the fact that I get -0- peaks from any combination of samples; although, the tool gives from the other hand no error. Please see how the corresponding mappings look like in IGB in the Image_2 (see attachments).

The above is already a very not normal appearance of all 3x TF3s.
On the other hand, when I am using the same 2x Wt for the analysis of the TF1 & 2, where I got stat. sign. Peaks. Please see in the Image_3 (see attachments) how this mapping looks
This looks very normal, from my experience.
I am also thinking that If we would assume that the TF3 had no real binding positions then I should be getting, more less the same appearance of the distribution of the peaks over the chromosome as the Wts; but this is not the case. From the other side, all 3x biol. repl. of the TF3 look the same. The same ab did work nicely for the other two TFs. And the pipeline of my analysis with GALAXY works also nicely for the other 2x TFs. My personal feeling is that I do (or do not) something during the analysis of the TF3, thus I do get no peaks… Bottom line is that I would like to know, if I have a technical issue with my analysis or if simply the TF3 does not bind anywhere at this dev. stage.
Could you please help me?
I would highly appreciate any help?
Greetings,
Manolis